What TikTok Creator Marketing Data Actually Shows About Performance
Completion rate and niche fit matter far more than follower count for TikTok campaign performance.

Most brand teams judge TikTok campaigns by the wrong numbers. Follower count, raw reach, and total likes still dominate how creators get picked and how results get reported, but none of those three numbers are what TikTok's distribution system actually responds to. That's not a measurement inconvenience. TikTok's reach architecture runs on a different logic than other major social platforms: 68% of TikTok content reach comes from non-followers, the highest share of any major social platform. A creator's follower count tells a brand almost nothing about who will actually see a given post. The rest of this piece sets aside the vanity numbers and walks through the signals that actually govern whether content spreads and whether it sells.
The mismatch runs deeper than a bad habit. Because TikTok decides distribution algorithmically rather than pushing content straight to followers, the metrics that predict whether a video gets seen are different from the metrics brand teams have used for years to pick creators and judge campaigns. That's not a small calibration error. Teams are optimizing for signals the algorithm doesn't weight, while the signals it does weight go untracked. Strong reach, a big follower base, and respectable like counts appear on dashboards that look fine even as the campaign never compounds into anything bigger. Meanwhile a much smaller program, built around the right signals, can scale fast with a fraction of the budget.
TikTok's FYP gate system and content distribution
TikTok doesn't push a video to a creator's full audience and call it done. It runs every piece of content through a sequential test, sending it to a small seed audience first and reading how that group reacts before deciding whether to expand the push. That test group runs roughly 100 to 500 viewers. What the algorithm reads in that window is completion rate: how many people who start the video watch it through.
This single mechanical fact changes who deserves a creator budget. A creator with a small but genuinely engaged following now has a more reliable shot at broad distribution than a creator with a huge but passive one, because the gate test doesn't care how many people follow the account. It cares how the seed group behaves.
Rewatch rate adds another layer to that same signal. A rewatch rate above 15 to 20% tells the algorithm that viewers found enough value in the video to watch it again. That's a stronger behavioral signal than a like, because a like costs a viewer nothing and a rewatch costs them time. Once this gate mechanism is clear, the rest of the performance data stops looking like a list of arbitrary metrics and starts looking like a direct readout of how the algorithm actually makes decisions.
Completion rate as the metric that governs TikTok reach
Completion rate has taken over as the main performance signal on TikTok, and the bar for hitting broad distribution has gone up. In 2026, completion rate is the single most important metric in TikTok's algorithm. It replaced follower count, which TikTok has confirmed was never a direct ranking factor to begin with. The key shift in 2026 came from two changes at once: a follower-first seeding model, where a creator's own audience gets tested before anyone else sees the content, and a viral threshold that is now around 70% completion.
Campaign data backs this up directly. Analysis of active brand campaigns shows budget is shifting toward creators who post consistent 70%-plus completion rates, and away from creators chosen mainly for their follower totals. Optimizing for completion rate moves reach by 3 to 5 times more than optimizing for likes, according to the research behind this shift. Optimizing for completion rate is the margin between a channel that compounds and one that plateaus.
A creator with a modest following whose videos routinely clear 70% completion is a better distribution bet than a macro creator whose audience scrolls past in the first five seconds. Reach follows attention, and attention is what completion rate measures.
Follower count remains the dominant creator selection criterion despite the evidence against it
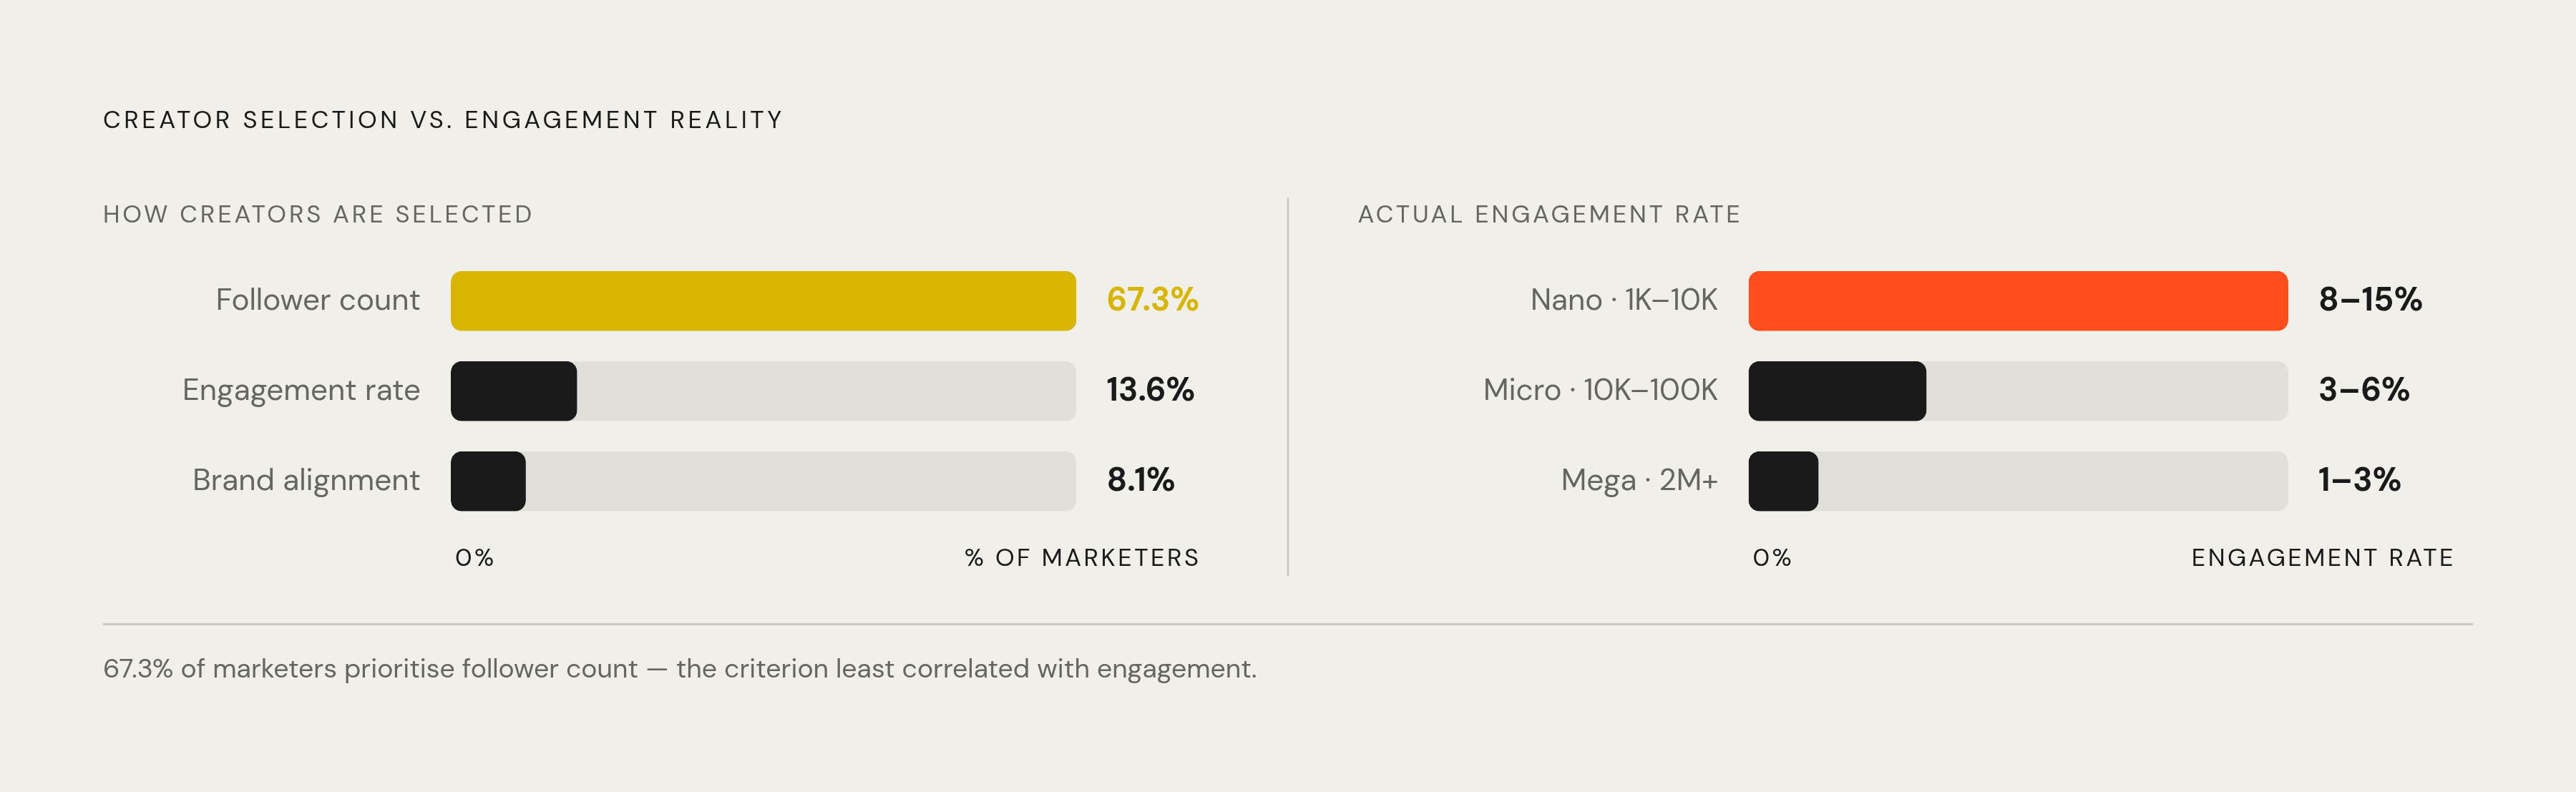
Given everything above, the obvious question is why follower count still runs most creator selection decisions. It does, and the gap between what the data shows and what brand teams actually do is wide. A full 67.3% of marketers pick TikTok creators mainly by follower count. Engagement rate comes in a distant second at 13.6%, and brand alignment sits last at 8.1%. Follower count wins the selection process despite a weak connection to actual distribution or conversion.
Part of the reason is practical. Follower count sits in a spreadsheet column, so a media buyer can compare ten creators in five minutes. Completion rate and historical GMV attribution require platform-level access and a more careful vetting process. The selection error is, in part, an operational shortcut.
That shortcut's cost is visible directly in engagement data. Nano creators, with 1,000 to 10,000 followers, pull engagement rates of 8 to 15%. Mega creators, with 2 million-plus followers, average just 1 to 3%. A brand choosing a mega creator over a nano creator on follower count alone is typically paying several times more money for a fraction of the engagement quality.
The market has started correcting faster than brand planning cycles can keep up. TikTok micro-creators, in the 15,000 to 50,000 follower range, saw their average partnership fees climb 125% year over year in Q1 2026. Macro creator fees fell 29% over the same stretch, and mega creator fees dropped 18%. Pricing is moving toward what actually performs well before most internal creator-selection processes have caught up to the same conclusion.
There's a fair counterargument here: large creators still deliver brand-safe reach and broad awareness at scale, and for a pure awareness campaign, that's a legitimate use case. But the case for follower-driven selection falls apart once the goal shifts to commerce and conversion. At that point, niche fit and completion rate are what move the numbers, not audience size.
Creator Selection for Completion Rate and Niche Fit
Picking the right creator means pulling a different data set than most brand teams currently gather: historical completion rates on content related to the product, niche alignment with the audience, and, for commerce programs, a track record of GMV attribution.
Follower-adjusted view counts make for a far better pricing input than raw follower totals. A creator with 80,000 followers who averages 500,000 views per video is reaching a mostly non-follower audience every time they post. If a deal prices off follower count alone, the number is wrong from the start.
For TikTok Shop and other commerce programs, vetting needs three specific data points: historical GMV attribution from past TikTok Shop activity, completion rates on product-related content specifically (lifestyle content completion doesn't predict how a product demo will perform), and the conversion rate from product views to actual purchases.
Niche fit changes conversion by an order of magnitude. Open collaboration with general creators converts at 2 to 4%. Targeted collaboration with creators matched to the niche converts at 8 to 12%. A beauty creator who promotes skincare to 500,000 beauty-focused viewers converts roughly 10 times better than a generalist creator who promotes the same product to 2 million mixed followers.
Performance inside a creator roster is never evenly spread. A small top cohort of creators drives most of the creator-attributed GMV in any given program. Treating every creator the same, same brief, same commission structure, same approval speed, is the structural problem that wastes the top tier's potential and learns nothing from the volume tier underneath it. The fix is tiering: different brief depth, different commission incentives, different Spark Ads priority depending on where a creator sits in that performance curve. This tiering is what lets a roster compound in value over time.
None of this is light lifting. Pulling creator analytics, cross-referencing TikTok Shop history, and managing tiered relationships at scale takes real operational structure. A disciplined partner-selection process starts paying for itself there.
UGC Volume and Performance Thresholds
Volume matters here, but not for its own sake. Running a high number of UGC videos is about generating enough independent shots at the completion-rate thresholds the algorithm and the brand both need to see, so the program can actually learn something from the results.
Think about it as a probability problem. Four videos, each produced at a high standard, give you four independent chances to clear the algorithm's gate. One video, no matter how close to perfect, gives one chance. Over time, more videos mean more data points to learn from and better odds of landing in front of the algorithm's wider distribution pool.
Only 3 to 5% of seeded creators end up producing content that drives sales at scale. That ratio sets the math for the whole program: it has to seed creators at volume, because expecting strong results from a small, hand-picked roster without enough volume behind it undermines the model from the start. Volume is an ongoing process here, closer to a pipeline than a one-time push, because the 3 to 5% hit rate only pays off when there's enough coming in behind it.
Turning high-performing organic content into paid assets through Spark Ads
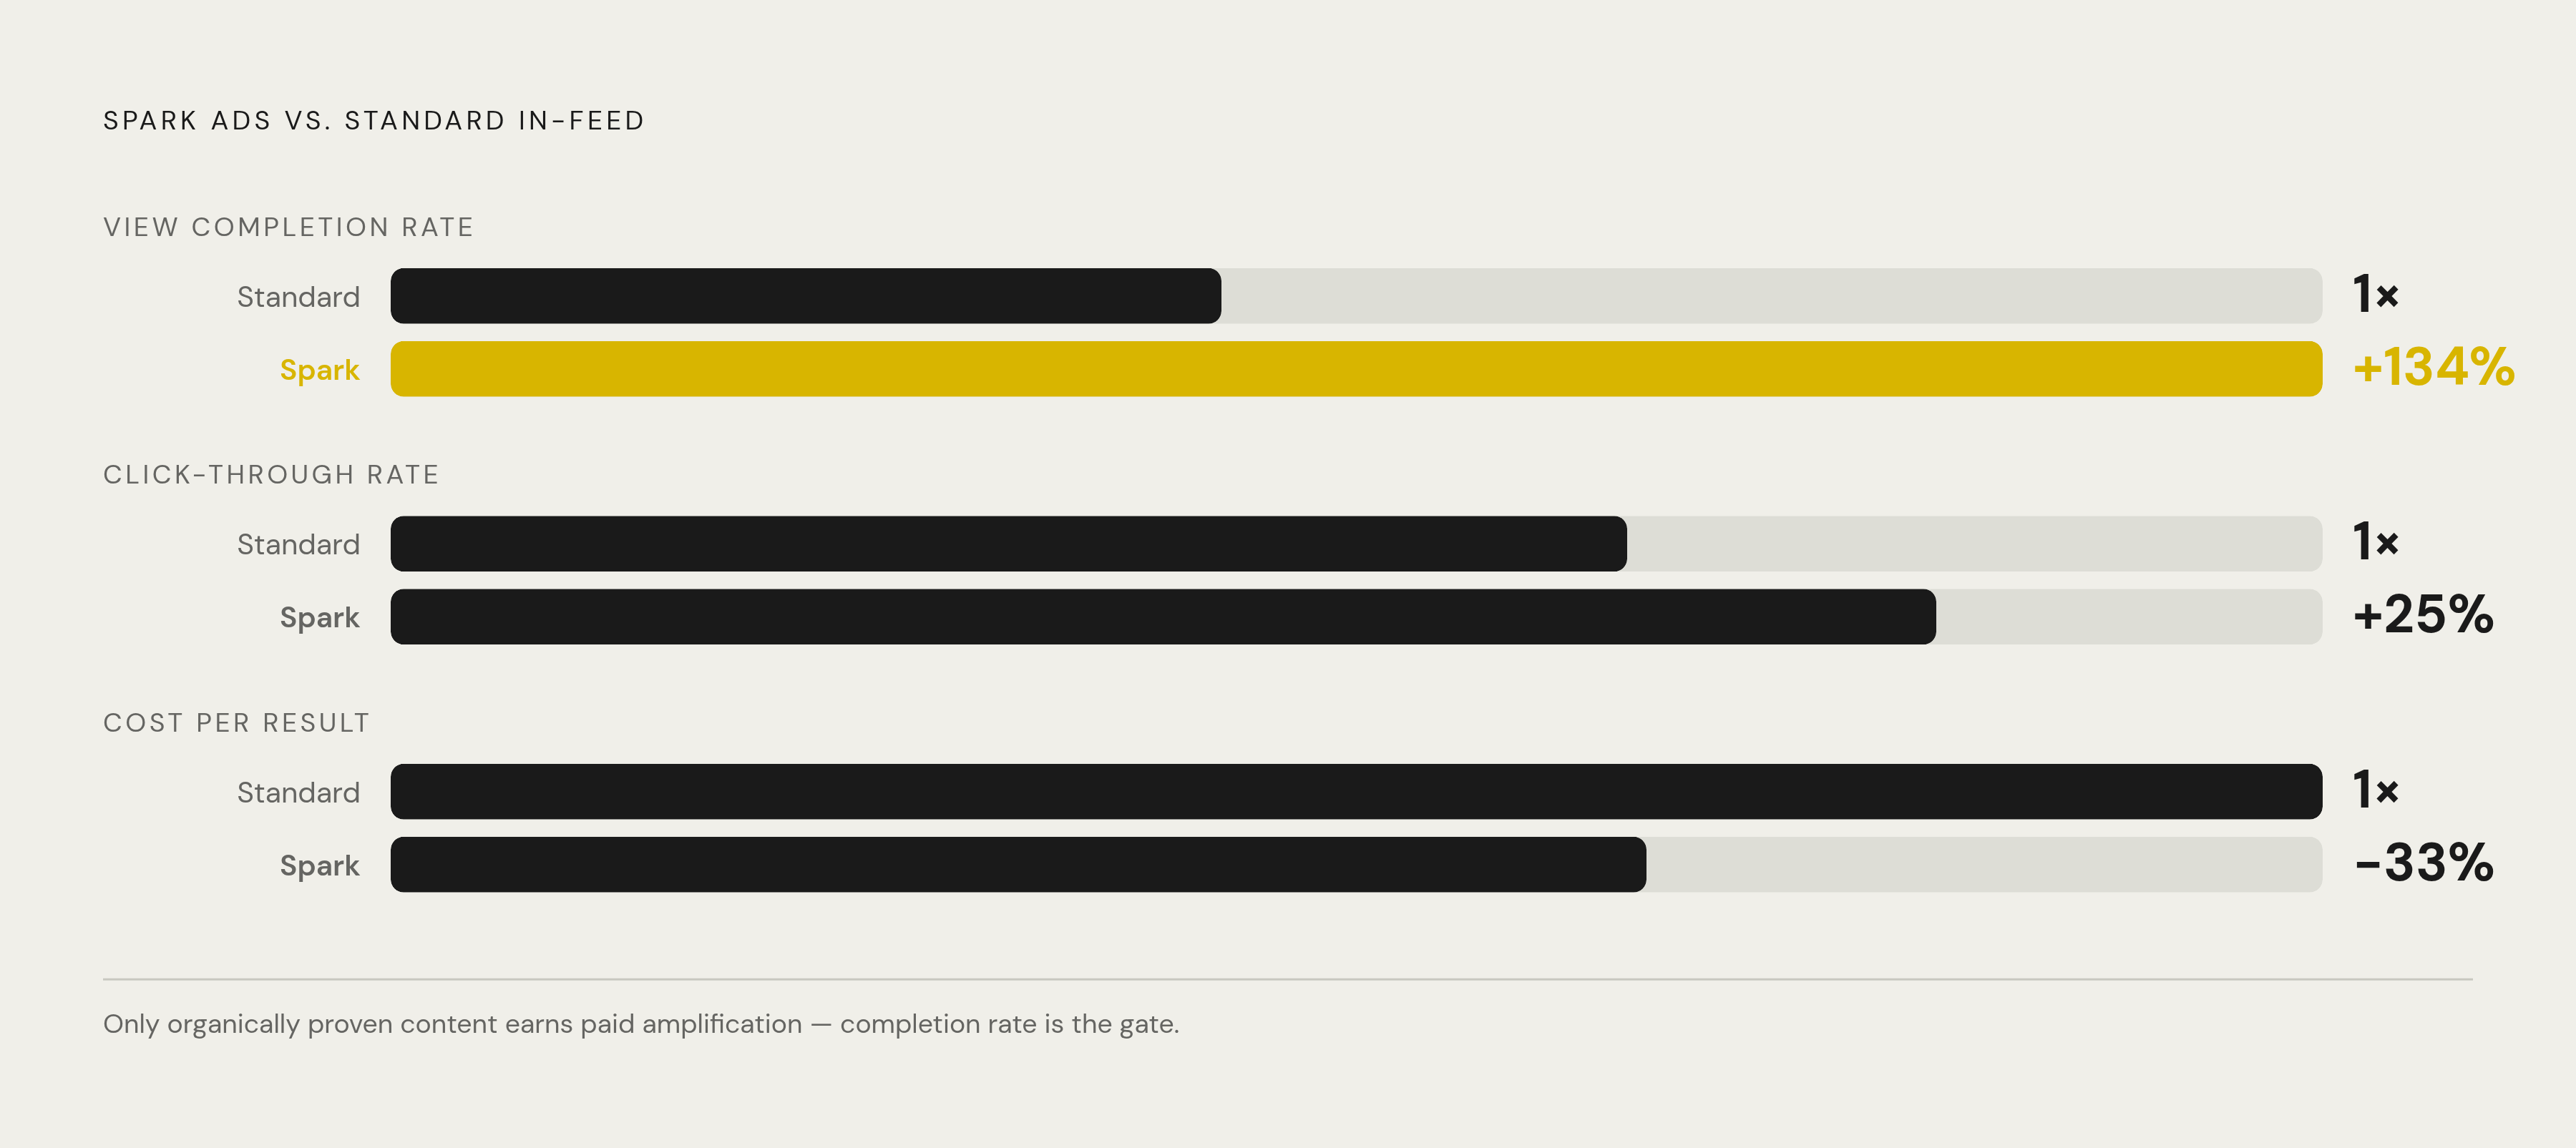
Spark Ads take content that has already proven itself organically and turn it into a paid channel that scales. Only content with strong organic signals is worth putting money behind.
The performance gap between Spark Ads and standard in-feed ads includes 134% higher view completion rates, roughly 25% higher click-through rate, and 25 to 40% lower cost per result. That gap exists because Spark Ads keep the creator's handle, comments, and social proof intact, and a standard brand-run ad can't replicate that.
Selecting which videos to amplify matters as much as the amplification itself. Product demo videos make strong Spark Ads candidates if their completion rates run above 25%. Videos below 15% completion are unlikely to convert efficiently no matter how much paid budget sits behind them. Spending against weak organic content wastes the budget and muddies the attribution data a team needs to make the next decision well.
Before running a program at scale, you need to understand how authorization works. Creators generate a post-specific authorization code with an expiry window set at 7, 30, 60, or 365 days, and the brand enters that code into TikTok Ads Manager. There's no option to whitelist a creator permanently. Authorization has to be renewed and managed on an ongoing basis, making Spark Ads a continuous operational task.
Creative fatigue follows a specific pattern: click-through rate dropping below 1% from a 2 to 3% baseline, CPM climbing more than 30% week over week, ROAS declining even with stable targeting, and frequency climbing past 3.0. Programs that skip rotating creative on that schedule end up paying for the fatigue directly out of ROAS.
The KPI stack that makes creator program performance measurable and improvable
A creator program becomes genuinely improvable only once it tracks unit-level numbers, not program-wide totals. GMV per creator, completion rate by content type, and cost per acquisition tell a team what's working. A single total GMV figure for the whole program doesn't.
Total GMV fails for the same reason follower count fails at the creator level: it confirms the program is making money without showing which creators, which content formats, or which brief structures are actually driving that revenue. Without that breakdown, every decision about where to spend next is a guess.
GMV per creator is the better unit of analysis. It tells a team whether to adjust a commission, shift Spark Ads budget, or move a creator up or down a tier.
Contracts should match what the program is actually trying to optimize. Revenue-based deals that lock in attributed sales through unique codes or trackable links, paired with a CPA ceiling that automatically scales payout down if cost per acquisition goes over an agreed cap, line up incentives far better than a flat impression-based deal that pays out regardless of whether anything converts.
Programs built around these unit-level KPIs can do something a follower-count-driven program structurally can't: tell which creative formats are working, which creator tiers are converting, and where to put the next dollar of amplification spend. This compounds a program's learning over time instead of starting from zero with every new campaign.
How brands engineering repeatable TikTok results structure their programs
Brands that get repeatable results on TikTok aren't just getting lucky more often than everyone else. They've built structured programs that apply the performance signals covered above systematically, and they treat reproducing a viral moment as a design exercise, not a lightning strike.
Virality on TikTok follows a recognizable structural pattern: a strong hook, high search value, a runtime under 90 seconds, and an "edutainment" format that delivers real value while staying entertaining. The underlying goal in all of it is the share, because the algorithm reads a share as the strongest positive signal available and expands distribution in response.
Reproducing a viral result depends on knowing which variables actually produced it: completion rate, hook type, content format, creator tier, and brief structure. A program tracking those variables at the individual-video level can reconstruct the conditions that worked. A program that doesn't track them starts from scratch after every success, win or lose.
The operational load behind a data-driven TikTok program includes high-volume creator outreach, tier-based relationship management, completion-rate vetting, ongoing Spark Ads authorization cycles, and KPI tracking at the creator level. That's enough work that it tends to degrade either the program or the core brand team if it gets treated as a side task squeezed into an existing role.
The brands pulling ahead treat TikTok creator marketing as a systematic, data-informed growth channel, not a one-off influencer buy or a line item under brand awareness. They build creator relationships, performance data, and TikTok Shop infrastructure that keep paying off campaign after campaign.